# to render w/ a different product type:
# quarto render dashboard.qmd -P product_type:PremiumS-mobile Customer Churn
import pandas as pd
# from helpers import color_palette, plpipot_churn_reason, plot_contract_type, table_purchases
from matplotlib import rcParams
from itables import show
import matplotlib.pyplot as plt
import seaborn as sns

rcParams.update({"savefig.bbox": "tight"})

churn = pd.read_parquet('s_mobile.parquet')
churn.drop('customer', axis=1, errors='ignore', inplace=True)
Churn
Row
dict(
  icon = "archive",
  color = "light",
  value = "69,000"
)
{'icon': 'archive', 'color': 'light', 'value': '69,000'}dict(
icon = "graph-down",
color = "light",
value = "20,100"
){'icon': 'graph-down', 'color': 'light', 'value': '20,100'}dict(
icon = "graph-down",
color = "light",
value = "48,900"
){'icon': 'graph-down', 'color': 'light', 'value': '48,900'}dict(
icon = "bullseye",
color = "warning",
value = "20%"
){'icon': 'bullseye', 'color': 'warning', 'value': '20%'}Row
plt.figure(figsize=(10, 6))
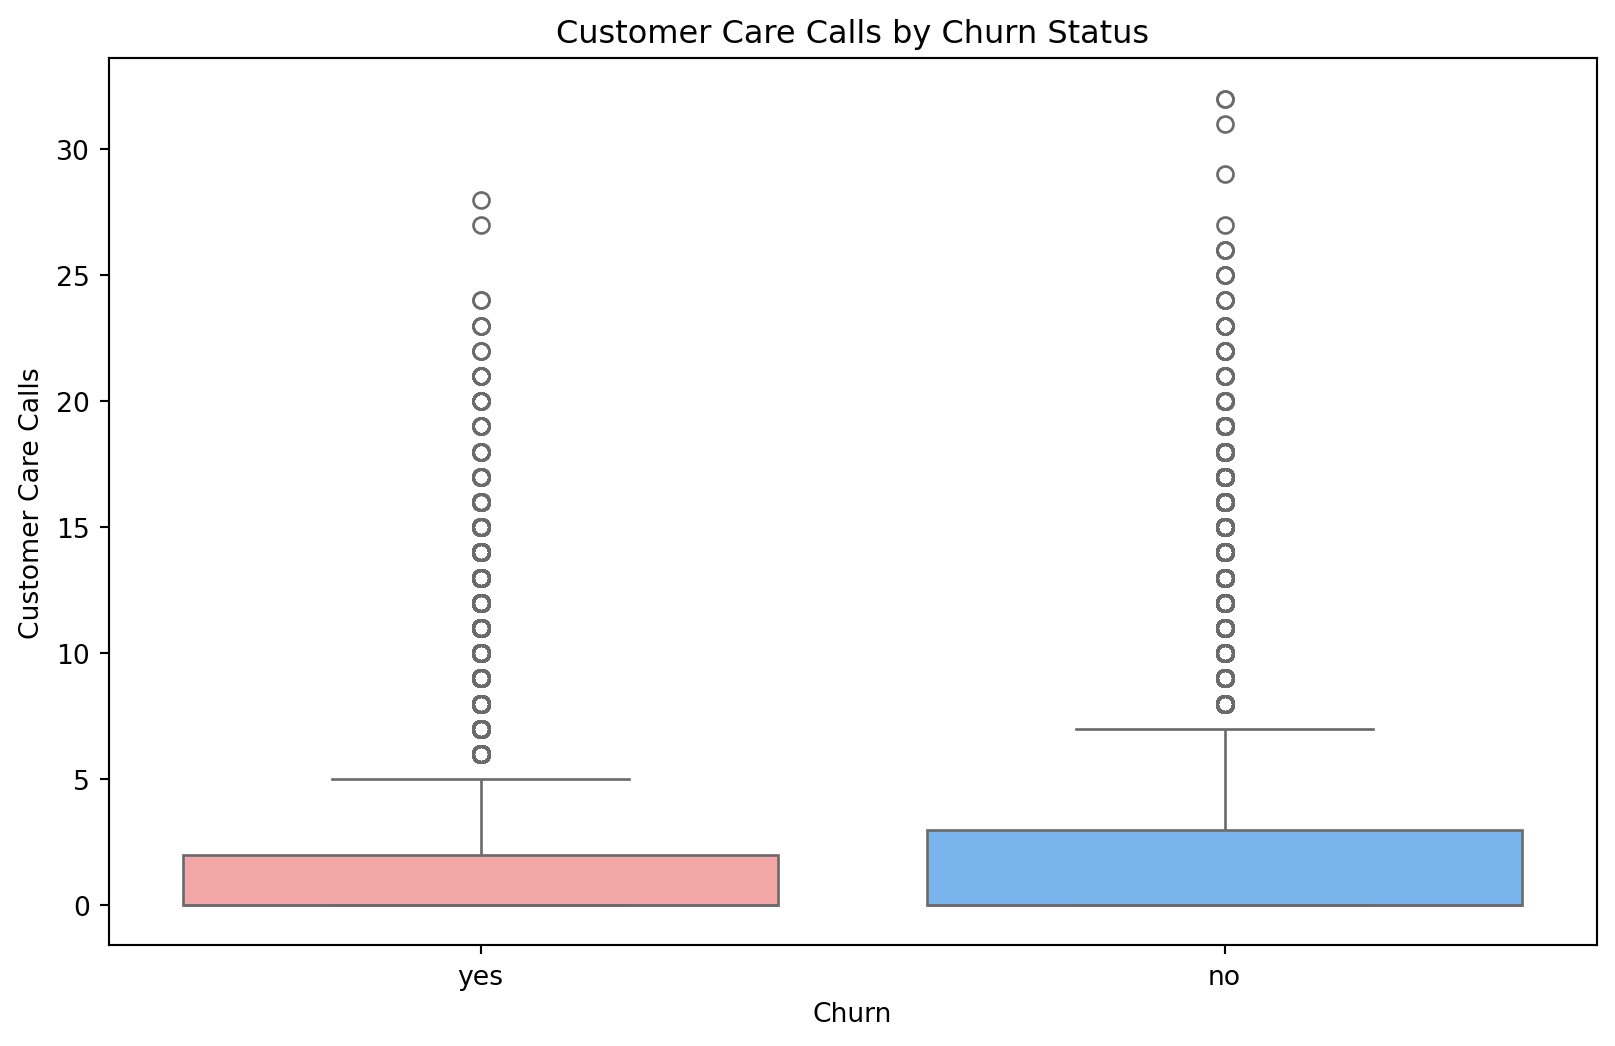
sns.boxplot(x='churn', y='custcare', data=churn, palette = ['#ff9999', '#66b3ff'])
_ =plt.title('Customer Care Calls by Churn Status')
_ =plt.xlabel('Churn')
_ =plt.ylabel('Customer Care Calls')
plt.show()/var/folders/28/cfl1_cfs3bb536qkz8wkys_w0000gn/T/ipykernel_85583/423151031.py:2: FutureWarning:
Passing `palette` without assigning `hue` is deprecated and will be removed in v0.14.0. Assign the `x` variable to `hue` and set `legend=False` for the same effect.
plt.figure(figsize=(10, 6))
sns.countplot(x='refurb', hue='churn', data=churn, palette = ['#ff9999', '#66b3ff'])
_ =plt.title('Churn Rate by Refurbished Status')
_ =plt.xlabel('Refurbished Status')
_ =plt.ylabel('Count')
plt.show()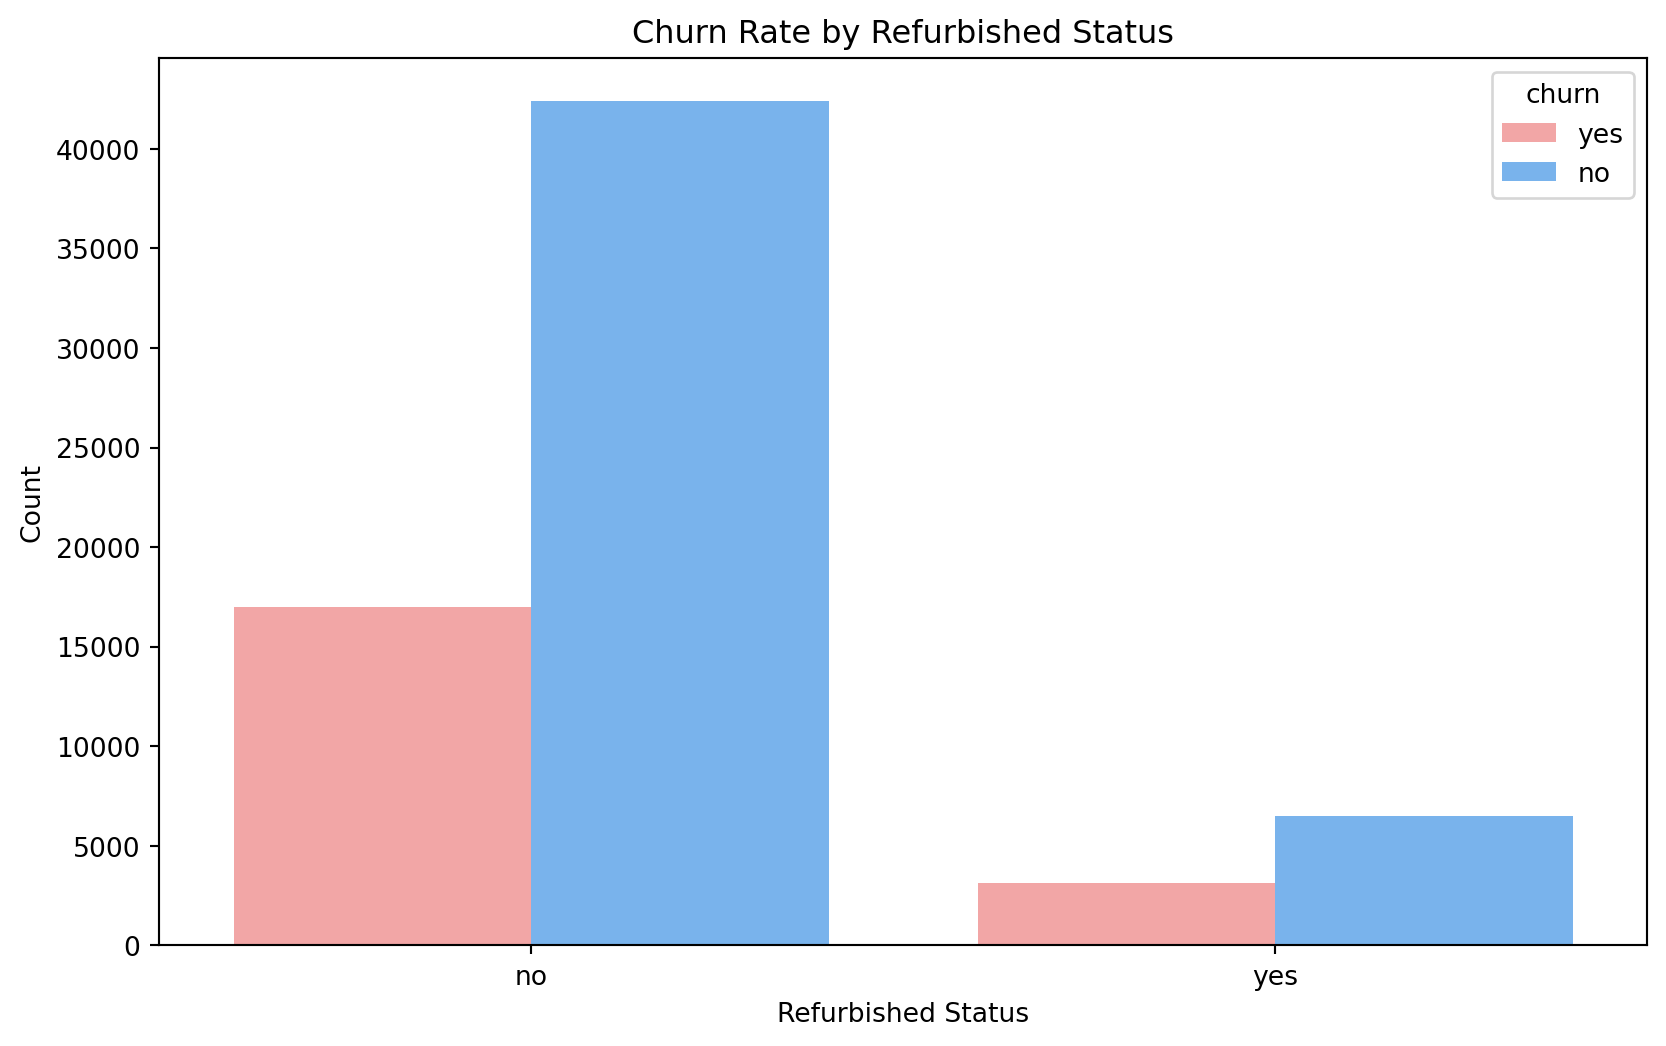
Row
plt.figure(figsize=(10, 6))
mapping_dict = {'yes': 1, 'no': 0}
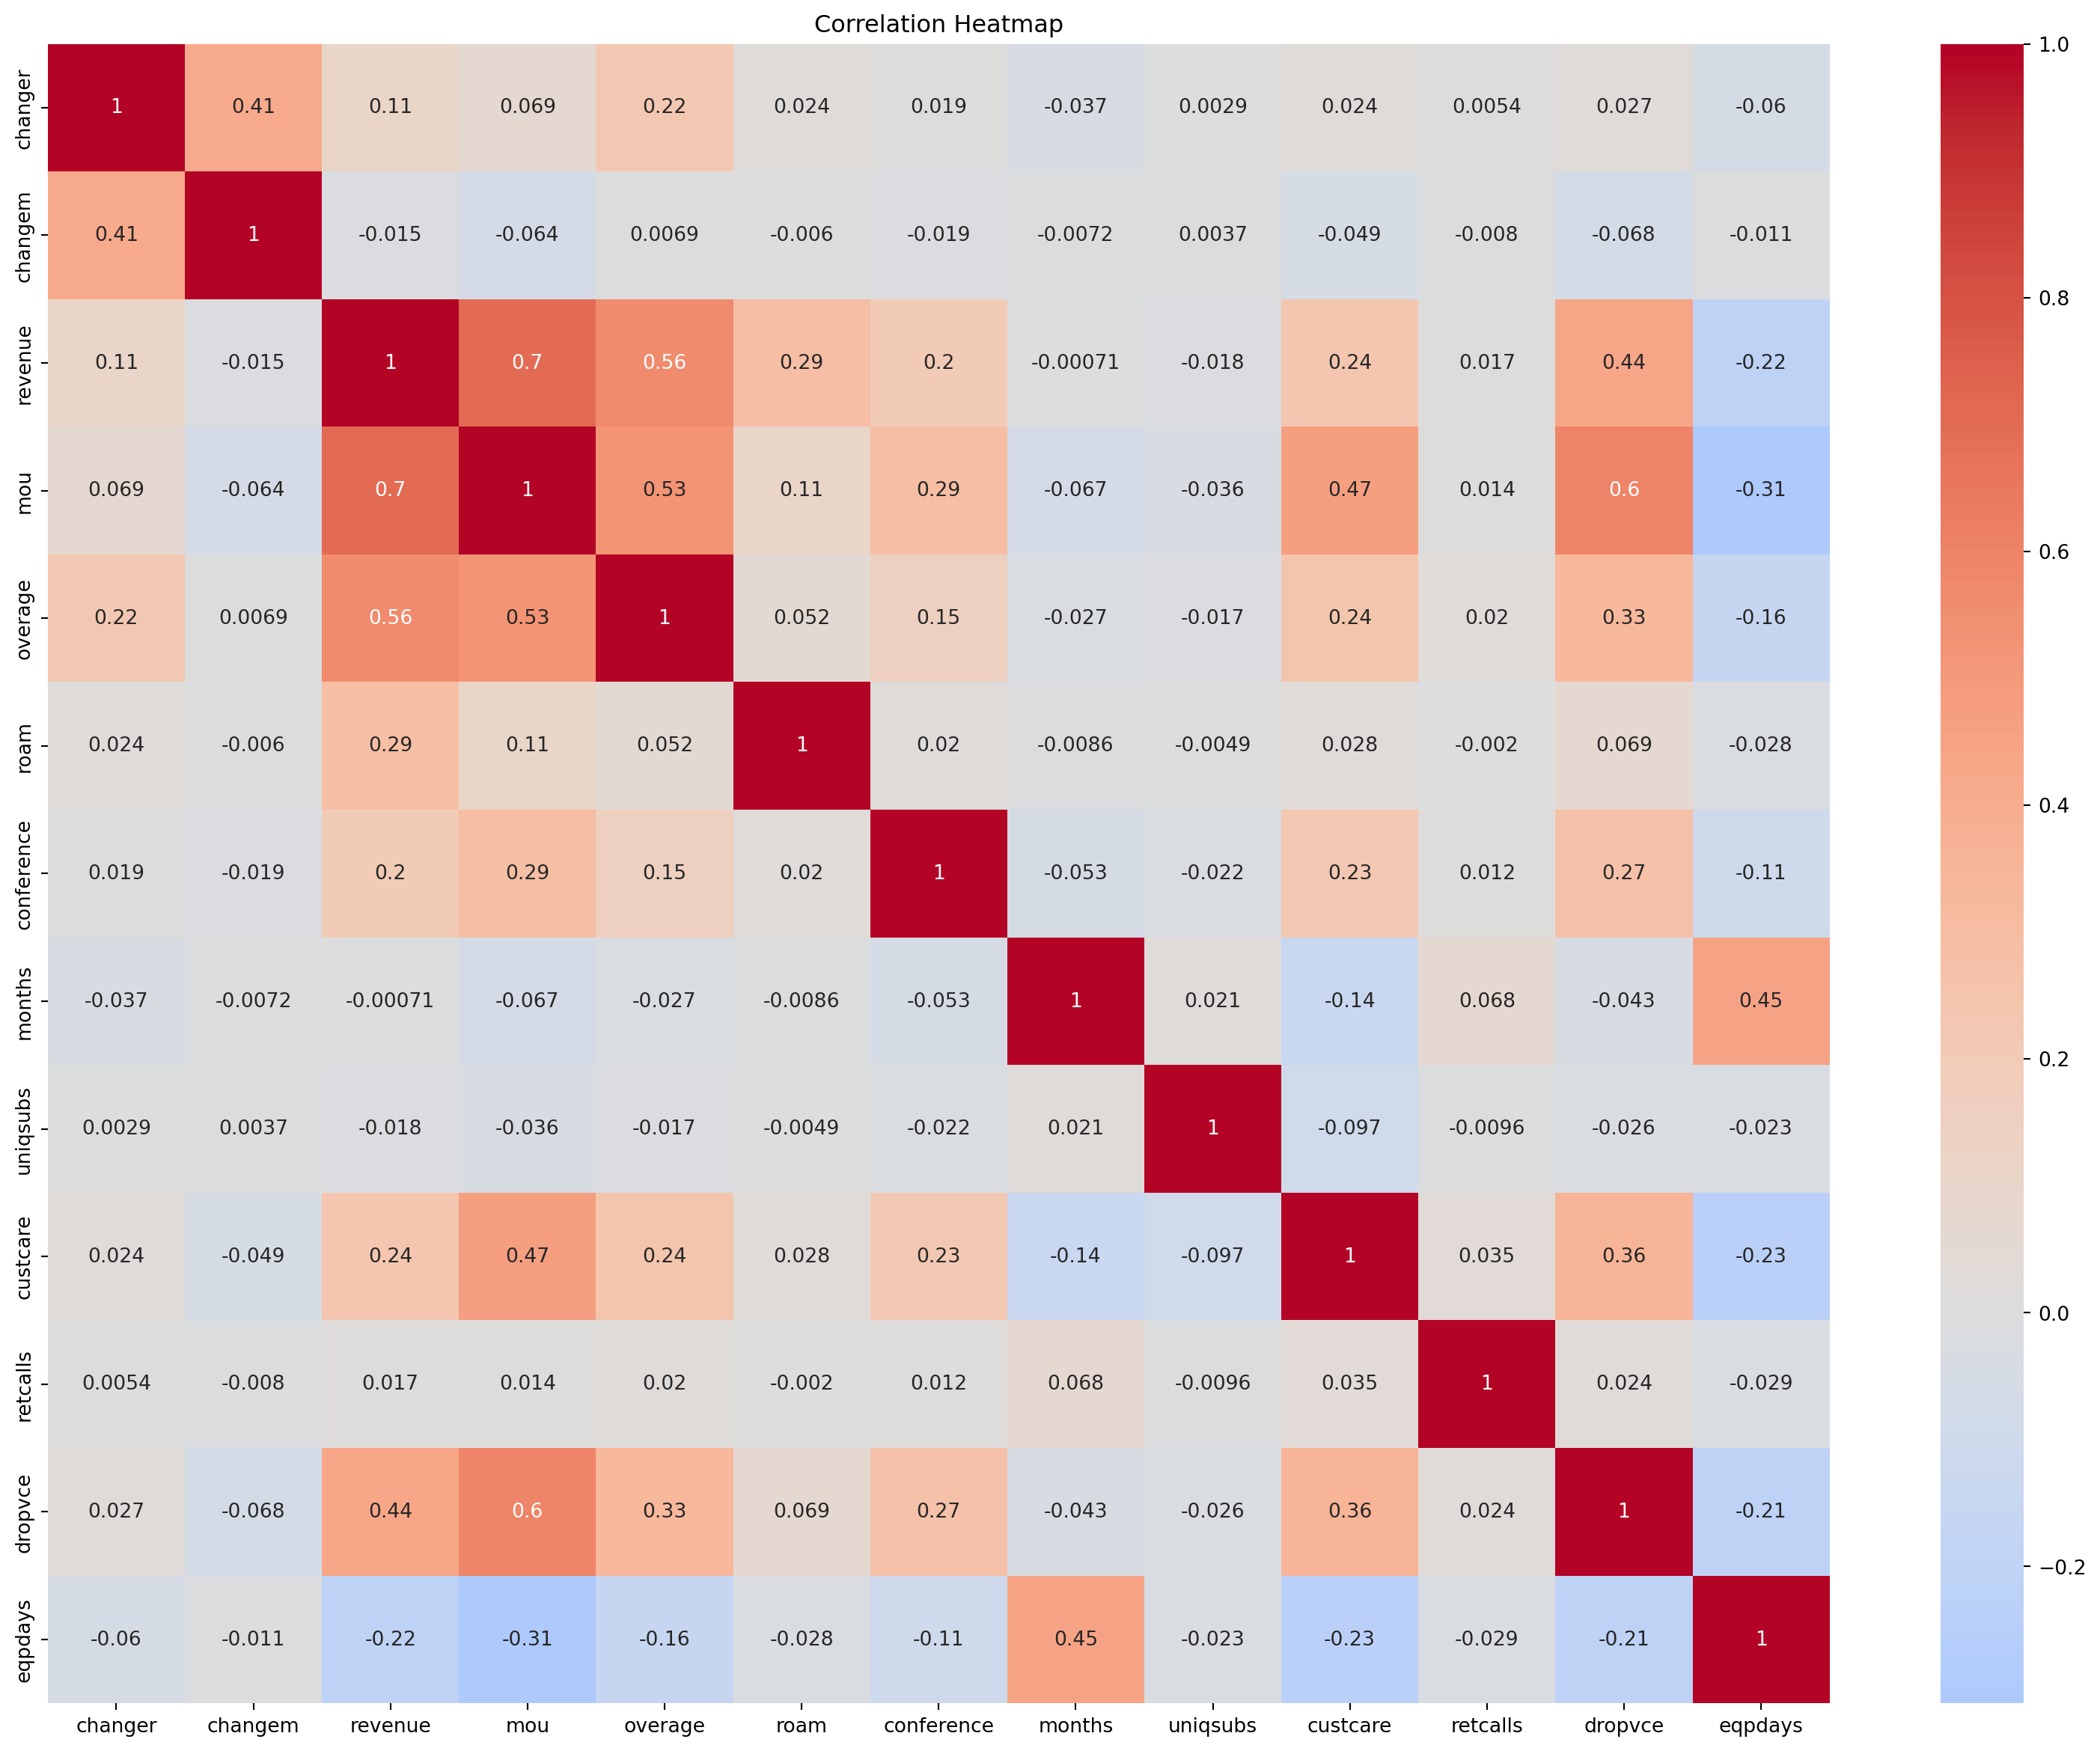
churn_num = churn[['changer', 'changem', 'revenue', 'mou', 'overage', 'roam', 'conference', 'months', 'uniqsubs', 'custcare', 'retcalls', 'dropvce', 'eqpdays']]
for col in churn_num.columns:
if churn_num[col].dtype == 'object': # only apply map to object columns
churn_num[col] = churn_num[col].map(mapping_dict)
# Now, convert the remaining non-numeric values to NaN
for col in churn_num.columns:
churn_num[col] = pd.to_numeric(churn_num[col], errors='coerce')
corr = churn_num.corr()
sns.heatmap(corr, annot=True, cmap='coolwarm', center=0)
_ =plt.title('Correlation Heatmap')
plt.show()/var/folders/28/cfl1_cfs3bb536qkz8wkys_w0000gn/T/ipykernel_85583/2138873192.py:11: SettingWithCopyWarning:
A value is trying to be set on a copy of a slice from a DataFrame.
Try using .loc[row_indexer,col_indexer] = value instead
See the caveats in the documentation: https://pandas.pydata.org/pandas-docs/stable/user_guide/indexing.html#returning-a-view-versus-a-copy
plt.figure(figsize=(10, 6))
sns.scatterplot(x='mou', y='revenue', hue='churn', data=churn, palette=['#ff9999', '#66b3ff'])
_ =plt.title('Revenue vs. Minutes of Use by Churn Status')
_ =plt.xlabel('Minutes of Use')
_ =plt.ylabel('Revenue')
plt.show()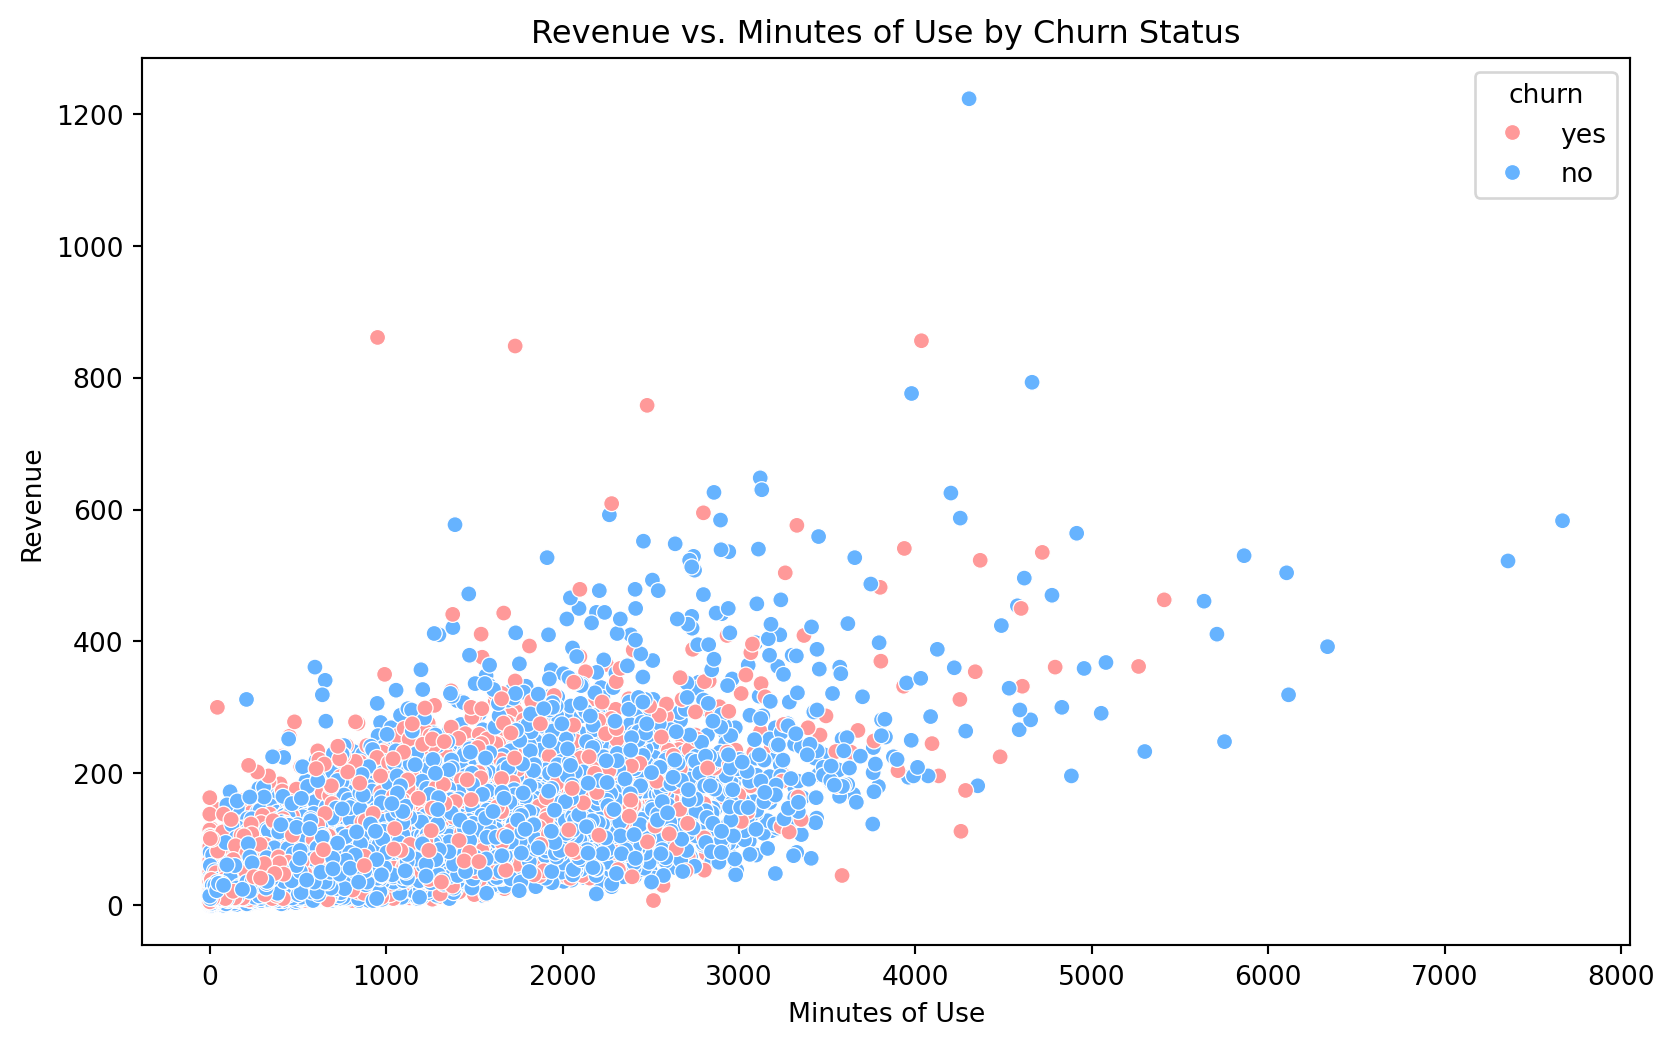
Row
# Calculate summary statistics
total_customers = churn.shape[0]
churned_customers = churn[churn['churn'] == 1].shape[0]
non_churned_customers = churn[churn['churn'] == 0].shape[0]
churned_percentage = (churned_customers / total_customers) * 100
non_churned_percentage = (non_churned_customers / total_customers) * 100

# Revenue and usage metrics
revenue_stats = churn['revenue'].describe()
mou_stats = churn['mou'].describe()
overage_stats = churn['overage'].describe()
roam_stats = churn['roam'].describe()
conference_stats = churn['conference'].describe()

# Customer service interaction
custcare_stats = churn['custcare'].describe()
retcalls_stats = churn['retcalls'].describe()
dropvce_stats = churn['dropvce'].describe()

# Device and service attributes
refurbished_percentage = (churn['refurb'] == 1).mean() * 100
smartphone_percentage = (churn['smartphone'] == 1).mean() * 100
highcreditr_percentage = (churn['highcreditr'] == 1).mean() * 100
mcycle_percentage = (churn['mcycle'] == 1).mean() * 100
car_percentage = (churn['car'] == 1).mean() * 100
travel_percentage = (churn['travel'] == 1).mean() * 100

# Regional and demographic insights
region_distribution = churn['region'].value_counts(normalize=True) * 100
occupation_distribution = churn['occupation'].value_counts(normalize=True) * 100

# Create a summary statistics table
summary_table = pd.DataFrame({
    'Metric': [
        'Total Customers', 'Churned Customers', 'Non-Churned Customers', 'Churned Percentage', 'Non-Churned Percentage',
        'Mean Revenue', 'Median Revenue', 'Revenue Std Dev',
        'Mean MOU', 'Median MOU', 'MOU Std Dev',
        'Mean Overage', 'Median Overage', 'Overage Std Dev',
        'Mean Roaming Calls', 'Median Roaming Calls', 'Roaming Calls Std Dev',
        'Mean Conference Calls', 'Median Conference Calls', 'Conference Calls Std Dev',
        'Mean Customer Care Calls', 'Median Customer Care Calls', 'Customer Care Calls Std Dev',
        'Mean Retention Calls', 'Median Retention Calls', 'Retention Calls Std Dev',
        'Mean Dropped Calls', 'Median Dropped Calls', 'Dropped Calls Std Dev',
        'Percentage with Refurbished Devices', 'Percentage with Smartphones',
        'Percentage with High Credit Rating', 'Percentage with Motorcycles',
        'Percentage with Cars', 'Percentage with International Travel',
    ],
    'Value': [
        total_customers, churned_customers, non_churned_customers, churned_percentage, non_churned_percentage,
        revenue_stats['mean'], revenue_stats['50%'], revenue_stats['std'],
        mou_stats['mean'], mou_stats['50%'], mou_stats['std'],
        overage_stats['mean'], overage_stats['50%'], overage_stats['std'],
        roam_stats['mean'], roam_stats['50%'], roam_stats['std'],
        conference_stats['mean'], conference_stats['50%'], conference_stats['std'],
        custcare_stats['mean'], custcare_stats['50%'], custcare_stats['std'],
        retcalls_stats['mean'], retcalls_stats['50%'], retcalls_stats['std'],
        dropvce_stats['mean'], dropvce_stats['50%'], dropvce_stats['std'],
        refurbished_percentage, smartphone_percentage,
        highcreditr_percentage, mcycle_percentage,
        car_percentage, travel_percentage,
    ]
})

summary_table| Metric | Value | |
|---|---|---|
| 0 | Total Customers | 69000.000000 |
| 1 | Churned Customers | 0.000000 |
| 2 | Non-Churned Customers | 0.000000 |
| 3 | Churned Percentage | 0.000000 |
| 4 | Non-Churned Percentage | 0.000000 |
| 5 | Mean Revenue | 56.959203 |
| 6 | Median Revenue | 46.000000 |
| 7 | Revenue Std Dev | 43.439200 |
| 8 | Mean MOU | 525.822290 |
| 9 | Median MOU | 366.000000 |
| 10 | MOU Std Dev | 530.024730 |
| 11 | Mean Overage | 64.076725 |
| 12 | Median Overage | 40.000000 |
| 13 | Overage Std Dev | 68.671857 |
| 14 | Mean Roaming Calls | 1.195493 |
| 15 | Median Roaming Calls | 0.000000 |
| 16 | Roaming Calls Std Dev | 9.083502 |
| 17 | Mean Conference Calls | 0.276275 |
| 18 | Median Conference Calls | 0.000000 |
| 19 | Conference Calls Std Dev | 1.173325 |
| 20 | Mean Customer Care Calls | 2.377652 |
| 21 | Median Customer Care Calls | 0.000000 |
| 22 | Customer Care Calls Std Dev | 4.253015 |
| 23 | Mean Retention Calls | 0.035290 |
| 24 | Median Retention Calls | 0.000000 |
| 25 | Retention Calls Std Dev | 0.201412 |
| 26 | Mean Dropped Calls | 2.986913 |
| 27 | Median Dropped Calls | 2.000000 |
| 28 | Dropped Calls Std Dev | 4.539006 |
| 29 | Percentage with Refurbished Devices | 0.000000 |
| 30 | Percentage with Smartphones | 0.000000 |
| 31 | Percentage with High Credit Rating | 0.000000 |
| 32 | Percentage with Motorcycles | 0.000000 |
| 33 | Percentage with Cars | 0.000000 |
| 34 | Percentage with International Travel | 0.000000 |
Data
show(churn)| churn | changer | changem | revenue | mou | overage | roam | conference | months | uniqsubs | custcare | retcalls | dropvce | eqpdays | refurb | smartphone | highcreditr | mcycle | car | travel | region | occupation | training | representative |
|---|---|---|---|---|---|---|---|---|---|---|---|---|---|---|---|---|---|---|---|---|---|---|---|
|
Loading ITables v2.0.1 from the internet...
(need help?) |
# show(churn[churn['product'] == product_type]
#   .groupby(['contract', 'state'])
#   .size()
#   .reset_index(name='count'))